Dashboard
The dashboard offers a comprehensive summary of your traffic performance. Key metrics such as Total Traffic, Total Terminations, Total Drops, and Total Revenue provide a concise overview of the previous month’s performance.
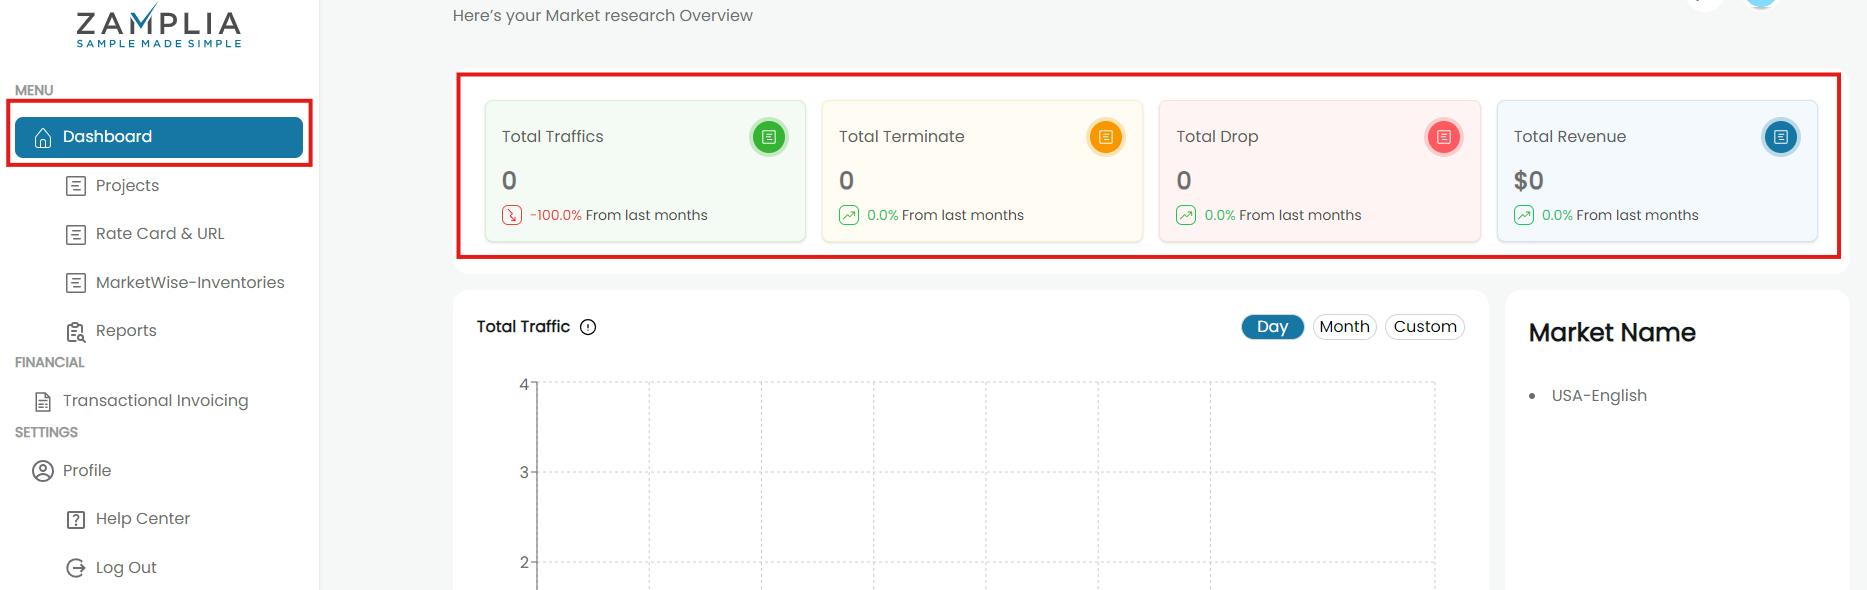
Total Traffics
Here you review the total volume of traffic directed to our inventory. You can assess whether traffic is increasing or decreasing compared to previous months, with changes displayed as a percentage.
Total Terminates
Here you can verify the total number of terminations recorded. This metric allows you to track whether terminations are rising or falling in comparison to previous months, expressed as a percentage.
Total Drop
You can check the total number of drops counted. You can monitor whether the number of drops is increasing or decreasing relative to previous months, shown as a percentage. The classic template will automatically be added to your project after you run the command:
Total Revenue
From this section you can review the total revenue generated. This metric enables you to see whether revenue is growing or declining compared to previous months, with changes presented as a percentage.