Report
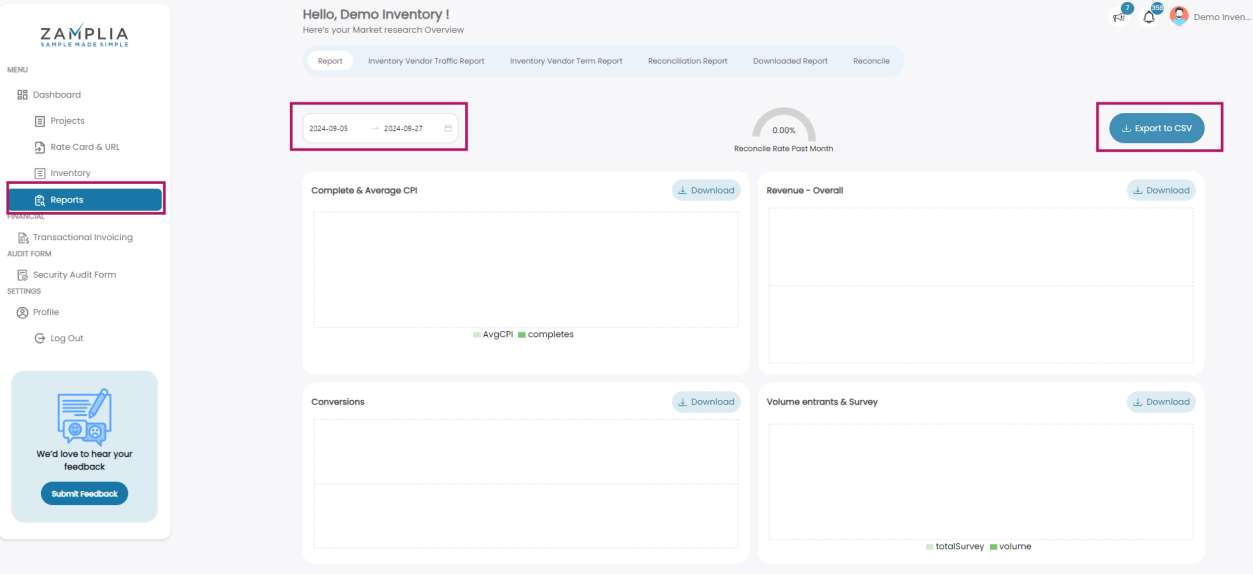
By clicking on the Report tab, you can view your performance report. Upon accessing the report tab, you will find:
- The first graph displays your Completions and Average CPI.
- The second graph shows your overall revenue.
- The third graph provides insights into the conversion rate of your traffic.
- The last graph details the volume of traffic sent and the number of surveys targeted on specific dates.
You can also download all the reports by clicking the Export to CSV button.
[Note: If no date is selected, the default report displayed in the Report tab will cover the last 7 days.]

Reconciliation Rate
The reconciliation rate meter displays the percentage of negatively reconciled IDs from your traffic. Our platform accepts a reconciliation rate of less than 5%.
Inventory Vendor Traffic Report

Step 1 - Click on the Inventory Vendor Traffic Report.
Step 2 - You can specify the time period for which you want to retrieve data by using the 'Start Date' and 'End Date' fields to apply your filters
Step 3 - The requested data will be displayed on your screen, and you can export it to an Excel file by clicking the Export button. After selecting the Export All button, your report will be transferred to the Downloaded Reports section, from which you can download the file. The exported file will include all relevant columns.
Inventory Vendor Term Report
This report provides insights into the reasons behind participant terminations, detailing which screeners they failed to qualify and subsequently were terminated.

Step 1 - Click on the Inventory Vendor Term Report button..
Step 2 - You can specify the time period for which you want to retrieve data by using the 'Start Date' and 'End Date' fields to apply your filters.
Step 3 - The requested data will be displayed on your screen, and you can export it to an Excel file by clicking the Export button. After selecting the Export All button, your report will be transferred to the Downloaded Reports section, from which you can download the file. The exported file will include all relevant columns.
Reconciliation Report
This report provides insights into the reconciliation status of participants.

Step 1 - Click on the Reconciliation Report button.
Step 2 - You can specify the time period for which you want to retrieve data by using the 'Start Date' and 'End Date' fields to apply your filters.
Step 3 - The requested data will be displayed on your screen, and you can export it to an Excel file by clicking the Export button. After selecting the Export All button, your report will be transferred to the Downloaded Reports section, from which you can download the file. The exported file will include all relevant columns.
Downloaded Report

This section allows you to export data to your Device.
Reconcile

Avg. Platform Reconciliation
In this section, you can see the average negative reconciliation:
For eg.
If your reconciliation rate for a specific market (e.g., EN-US) in September is double the platform's average rate:
You will receive an alert email at the beginning of October.
If this trend continues and your reconciliation rate remains double the platform's average in October for the same market:
You will receive another alert at the start of November.
At that time, you will be required to complete the security audit form.
The purpose of this process is to ensure that reconciliation rates are maintained within acceptable levels.
If high rates continue, we may need to discuss a plan of action to address the issue.